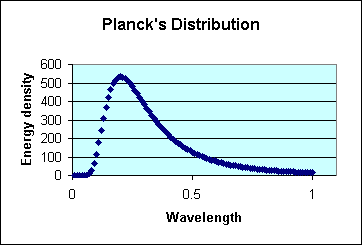

In Excel plot the function 8 p x - 5/( e 1 / x - 1 ) versus x for x=0.01 to x=1.00 with increments of 0.01. Remember first you make the column of x values. Then in the adjacent column you enter the formula replacing x with the cell reference (e.g. A1). Mine looks like:

You cannot make yours have the same background color as mine (so I know you made your own). Then save the Excel file as a web document (XML) Use File/Save As Web Page; you may need to click the double arrows to see this option. Make sure you pay attention to the name of the file being created and its location. Actually more than one file will be created; the one of interest here is a .gif file. You should probably rename the file, so you can remember its name.
Next, go to Word and create a new webpage document. Go to Format/Background and add a background texture. Place the graph you just made on the page (Insert/Picture/From File). One can format pictures, change their size, crop them, reposition them, etc.
Next start a blank presentation in PowerPoint. Using the Drawing Toolbar, create a design on a slide. My example is below:

Save your PowerPoint presentation as a web page document. Again it creates a folder full of files. The actual design you made will probably be called img001.gif. You should probably rename it. Insert it on the webpage you made in Word. One of the formatting options is to make a gif file transparent. That is, take the white background shown above and let the webpage background show through those areas. See below.
