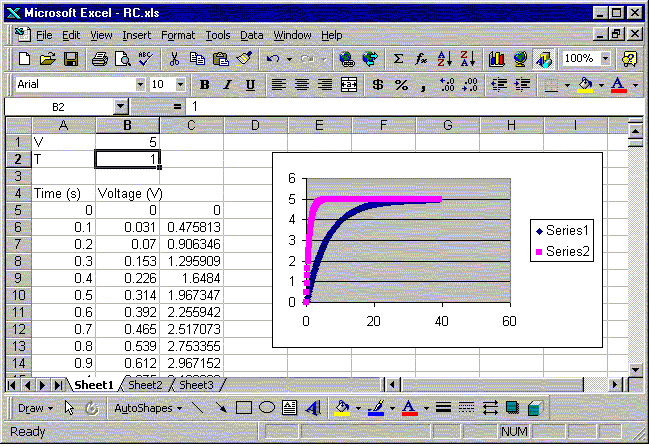

In this particular example, the parameter V determines the saturation value, the value at large times. Looking at the plot we see that the data (the blue curve) approaches 5 at large times. Thus we change the value in cell B1 to 5. When we do this the formulas in column C which refer to cell B1 and the plot are automatically updated.

