 Plotting the Electric Potential in Excel

First, we are going to make a grid of (x,y) values.
- Open up an Excel spreadsheet.
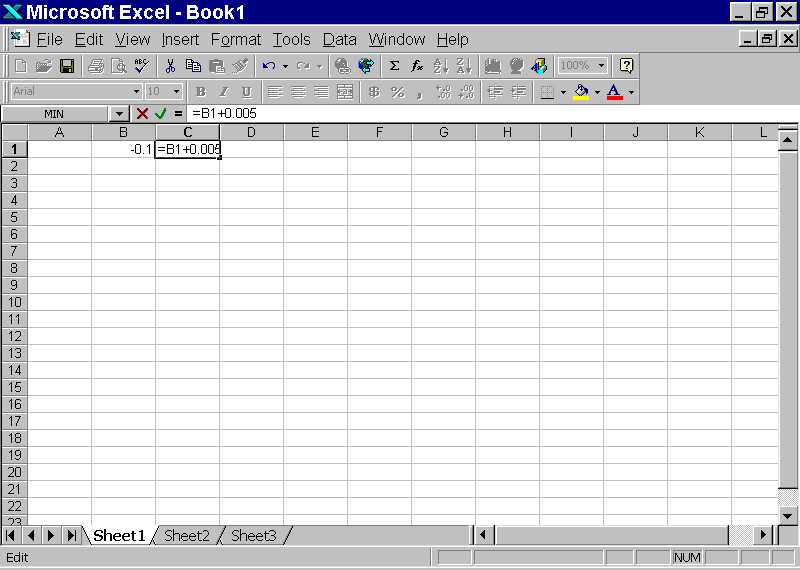
- Enter in cell B1: -0.1.
- Enter in cell C1 the formula: =B1+0.005 (as shown below).
- Copy the formula in cell C1 over into the adjacent cells
in the first row up to and including cell AP (which should
have a value 0.1).
NEXT
BACK