
 PYL 106: Superposition of Sound Waves


Superposition of Sound Waves
Superposition is just a fancy term for adding; in this case,
we are adding waves. In Part I of this experiment we have two
speakers generating waves of the same frequency but starting
in different positions (and heading in opposite directions).
Each wave travels from its source to a point at which we choose
to detect it. In general, the waves have traveled different
distances, and hence are at different parts of their cycles.
If the two waves are "in sync", i.e. have their maxima at the
same time, they are said to interfere constructively.
The combined amplitude of oscillation at that point is greater
than that of either individual wave. If the two waves are "out
of sync", i.e. one has its maximum when the other has its
minimum, they are said to interfere destructively.
The resulting amplitude of oscillation is less than that of either
individual wave.
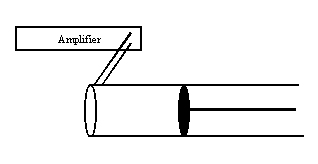
In Part II, there is only one speaker at the end of a tube, the
second wave in question is a reflection of the first. We will
look for incidents of resonance, situations in which the
wavelength and length of the system "match up" leading to constructive
interference and hence increased
intensity. (Do not read "matching up" as "being equal.") "Matching
up" means different things depending on whether the tube has open ends,
closed ends or one of each.
In Part III, we have again two speakers, but this time with
slightly different frequencies. In this situation, the two waves may be
in sync at one time and out of sync another time even if the position
of measurement is not changed. We will look for variations in the intensity
as a function of time (beats) rather than space.
Part I.
- Connect the power amplifier to the interface analog
channel A (as done last week).
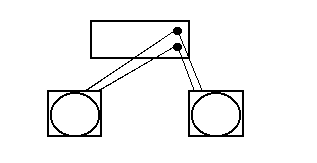
- Connect the amplifier to two speakers. (The same terminal
of the amplifier should be connected to the identical terminal
on the speaker, e.g. connect the lower power amplifier terminal
to the terminal on the outer edge of both speakers.)
-
Click on the image of the analog plug in Data Studio, choose
Power Amplifier.
- Choose an AC sine waveform of 1010 Hz. Calculate the wavelength of
the sounds waves at this frequency.
- Connect a microphone to Analog Channel B.
-
Click the image of the analog plug in Data Studio and
choose Sound Sensor.
- Click on Sampling Rate on the right-hand-side of Data Studio and change the sampling frequency to
100 Hz.
-
Under that use the drop-down list to change the sensitivity
to Medium.
- Place two speakers facing each other 1.00 meter apart.
- Place a meter stick between them (with the 50-cm mark in the
middle of the speakers).
- Drag a graph into channel B.
- Place the microphone (be sure it's on) at the 50-cm mark.
- Turn on the signal generator and briefly record some data.
-
You can click on the vertical scale of the graph if your graph is not using the
full height of the graph.
- Next beginning again at 50-cm, record data moving the
microphone 2 cm every 5 seconds (stop watches are available).
The data should then correspond to the following table.
(You are recording sound, so be as quiet as possible.)
Time
(s) | Position
(cm) |
Path difference
(cm) |
| 0-5 | 50 | 0 |
| 5-10 | 48 | 4 |
| 10-15 | 46 | 8 |
| 15-20 | 44 | 12 |
| 20-25 | 42 | 16 |
| ... | ... | ... |
Take data for at least one full minute.
Moving the position 2 cm changes the path difference 4 cm. Why?
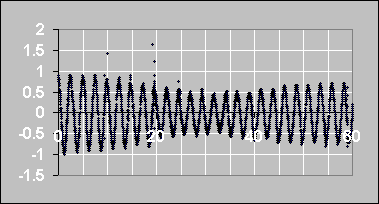
- Table the data, click on the clock, copy and paste the data
over to Excel and make a plot. It should look like the
following
- You can see the amplitude differs for the various 5-second
intervals. Because of procedure used, you can identify a time
interval with a positon. Note the positions of the minima or
maxima in intensities that you observe.
You are NOT looking at individual maxima and minima in the curve
above; you are looking at amplitudes for different five second
periods.
- What are the measured and theoretical positions of maxima
and minima?
| Measured | Theoretical |
| First maximum | | |
| First minimum | | |
| Second maximum | | |
- Switch the leads (where the wires plug in) on one of your
speakers.
- Repeat the process above beginning midway between speakers.
What happens? Why?
- What are the measured and theoretical positions of maxima
and minima?
Switched Leads
| Measured | Theoretical |
| First maximum | | |
| First minimum | | |
| Second minimum | | |
Part II.
- Connect your power amplifier to the small speaker at the end
of the long tube. (You can also use the portable function
generators which you may be able to take into another room
where it is quieter.)
- Input a 1700 Hz signal. What is the wavelength corresponding to
this frequency?
- Move the plunger the entire length of the tube. You should
hear a modulation in the intensity. (This may require some
cooperation among neighboring groups.)
- Note the plunger positions (to the nearest tenth of a centimeter,
if possible) at which these intensity maxima occur. Be careful to
distinguish positions at which the intensity is a maximum from positions
at which the intensity changes most rapidly.
Freq. = 1700 Hz
| Positions of Maximum Intensity ( ) |
| |
| |
| |
| |
| |
| |
| |
| |
- Based on the plunger positions where you find resonances,
determine whether the tube has open-open or open-closed boundary
conditions.
Explain your reasoning.
- Repeat the measurements and analysis with an 850 Hz signal.
Freq. = 850 Hz
| Positions of Maximum Intensity ( ) |
| |
| |
| |
| |
| |
| |
| |
| |
Part III.
- You will need two signal generators for this part. Team up with
another group if need be.
- You will have to reset the Sample Rate, which may require
closing and reopening Data Studio. Put the Sample rate of the Sound Sensor
at 2000 Hz.
- Attach one speaker to each signal generator.
- Set one at a frequency of 400 Hz, the other at 402 Hz.
- Place the two speakers near one another and see if you can
hear the beats (undulations in intensity).
- Next place a microphone near the speakers and record
the sound from the two speakers.
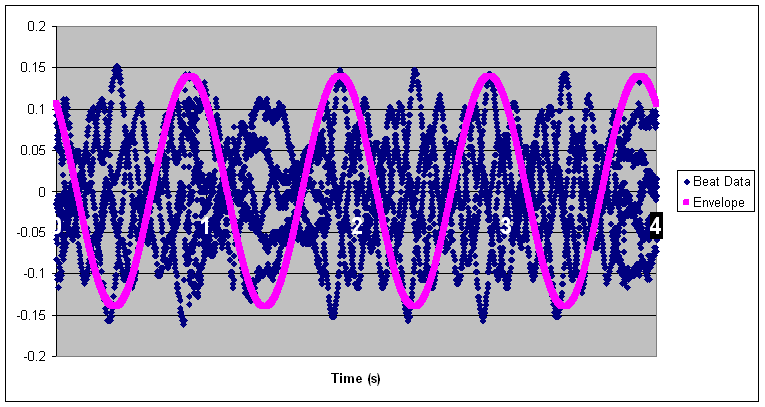
- Take your data (a couple undulations worth) over to
Excel and try to fit the "envelope function." It may help to
review the first lab. Your graph should look something like
the following
If it does not, see the instructor.
- Put somewhere in your report the equation of your fit
function.
- From the graph extract your "beat frequency". How does it compare
to the frequency of your envelope function?


 PYL 106: Superposition of Sound Waves


