
 PYL 106: Standing Waves on a String


Standing waves on a string
When you throw a rock into a pool, the water is disturbed. The water is shifted away from
its equilibrium position, the flat surface. This disturbance then moves in what we call
a "traveling wave." If a wave happens upon an abrupt edge (like the pool wall), it will be
reflected back. When there are two waves traveling in opposite directions, a possible outcome
is a "standing wave."
In the paticular situation of a standing wave, the disturbance does not appear to move but rather
just to oscillate in place. In fact, each point is undergoing periodic motion, all with the same period.
While the periods are all same, the amplitude varies from point to point. But of course, two points that
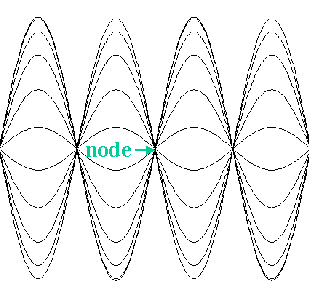
are very close must have nearly the same amplitude. There are special points, called nodes,
which have no amplitude at all. Below is a picture of a standing wave where the different lines
represent the wave at different times.

In addition to the notion of period T (the time required for the motion to
repeat itself), with harmonic waves one has the concept of wavelength λ (the
distance between two points that are undergoing identical motion). One has to be careful here
with standing waves. Our eyes tend tend to average what is happening over time. Two points that
seem to be udergoing identical motion may in fact be undergoing opposite motion but when "time-averaged"
appear to us to be identical. The speed of a wave is given by
v = λ / T
which is the distance between where the wave repeats itself divided by the time between when the wave
repeats itself. (When we talk about speed in a standing wave, we mean the speed of the two individual
waves that make up the standing wave. We are not talking about "transverse velocity.") We can determine
λ and T and find this speed. If the wave in question is on a string, theory provides us with
another expression for speed
v =
√ F / μ
= ( F / μ )1/2
where F is the tension in the string and μ is the linear mass
density (mass/length). One may see this equation written with a T for tension in place of F.
In such a case, be careful not to confuse tension T with period T.
Experiment
-
Plug in the power amplifier and connect it to the signal interface (use analog channel A).
Turn it on.
-
Connect the output of the amplifier to the speaker (two wires needed: one from the red
terminal on the power amplifier to the speaker, the second from the speaker back to the black
terminal of the power amplifier). One needs a complete circuit.
-
Start up Data Studio and click on the image of the analog plug into analog
channel A and choose "power amplifier."
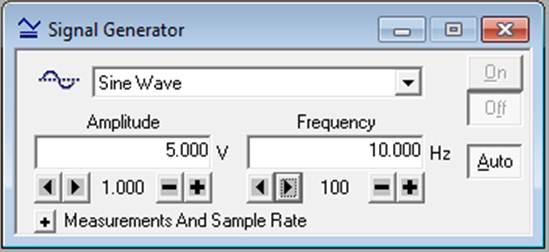
- A window labeled "Signal Generator" should appear. Choose an AC sine wave with amplitude 5.0 V
and frequency 10 Hz. To change the frequency, click on the number under "Frequency", type the desired
number and the hit Enter.

- Click on the left arrow button under the Frequency textbox (twice) to set the "change"
to 1 Hz. Then you will be able to use the plus and minus buttons to change the frequency by
1 Hz. You will need to search for standing wave patterns by varying the frequency, so the
plus and minus buttons will come in handy
-
Click on or perhaps Start at the top menu. The speaker should respond. Click off.
-
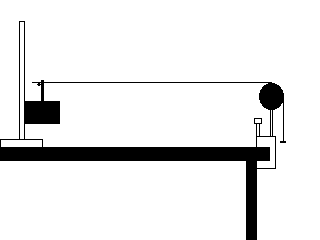
Mount the speaker to a stand a meter or so away from the edge of the table, as shown below
-
Place the banana plug connector (red plastic thing with notch) so that it is sticking out of
the top of the speaker.
-
On the edge of the table mount a universal clamp and to it a pulley. (You can use a "smart" pulley,
but there's no reason to plug it in.)
-
Obtain the linear mass density (mass/length) of the thick stretchy cord. (Take the
knots out the get a good measurement of the length.)
Thick stretchy cord
String mass
( ) |
String length
( ) |
linear mass density
( ) |
| | | |
-
Then
tie it to the ring stand and string it from the banana plug connector to the pulley and hang a hanger and
a weight on the end.
-
Secure the cord with a knot just outside the plug or tie it to the stand.
-
Turn the signal generator on. By varying the frequency, you should be able to establish a
standing wave pattern with clear nodes -- positions which do not seem to move.
-
Record the distance between nodes and the corresponding frequency.
-
Find standing wave patterns with more nodes by increasing the frequency or ones with fewer nodes
by decreasing the frequency. Try to find at least four different standing wave patterns.
Different patterns should have different number of nodes (and the frequency
should change by approximately 4 or more Hz.)
Thick Stretchy Cord, Force ( )
Frequency
( ) |
Distance
between nodes
( ) |
| | |
| | |
| | |
| | |
-
Vary the mass on the hanger and hence the tension F. Find a standing wave pattern and
measure the distance between nodes. (Whereas the principle of keeping one variable fixed
while you vary another is usually a good idea, it doesn't necessarily work here. You
may have to vary the
frequency so you can find a good standing wave pattern.)
-
For each tension find two standing wave patterns. Repeat the measurements for three more masses
(five different tensions altogether). Record the tensions and node-to-node distances. (Don't forget
to include the mass of the hanger.)
Thick stretchy cord
Force
( ) |
Frequency
( ) |
Distance
between nodes
( ) |
| | | |
| | | |
| | | |
| | | |
| | | |
| | | |
| | | |
| | | |
| | | |
| | | |
-
Replace the stretchy cord with a piece of string (or lighter
stretchy cord) and repeat all of the above
measurements.
Thin stretchy cord
String mass
( ) |
String length
( ) |
linear mass density
( ) |
| | | |
Thin Stretchy Cord, Force ( )
Frequency
( ) |
Distance
between nodes
( ) |
| | |
| | |
| | |
| | |
Thin stretchy cord
Force
( ) |
Frequency
( ) |
Distance
between nodes
( ) |
| | | |
| | | |
| | | |
| | | |
| | | |
| | | |
| | | |
| | | |
| | | |
| | | |
Analysis
For both the thick and thin stretchy cord:
-
For the first part in which the tension (force) was held fixed,
make a plot of the distance between nodes versus
1/frequency. Fit the data to a straight line.
- What is another name for 1/frequency?
- How is the slope related to the speed of the wave in the string?
- How does the speed compare to the v = (F /
μ )1/2 prediction?
Thick stretchy cord
Slope from graph
( ) |
Speed from graph
( ) |
Speed from (F / μ )1/2
( ) |
Percent Error |
| | | | |
Thin stretchy cord
Slope from graph
( ) |
Speed from graph
( ) |
Speed from (F / μ )1/2
( ) |
Percent Error |
|
|
|
|
|
-
For the second part in which the tension was varied, use v = λ / T (note
T is period not tension) to calculate the
speeds. Then make a plot of the speed versus tension. Fit it to a
power law.
- How does the wave's speed depend on the tension in the string?
- How does this compare with the theoretical prediction?


 PYL 106: Standing Waves on a String


 PYL 106: Standing Waves on a String


