 PYL 106: Fitting the Spring Data
PYL 106: Fitting the Spring Data
PYL 106: Fitting the Spring Data

Now let us choose the parameters to fit the data better.
The equilibrium position, yeq, is the midpoint
of the data. One can estimate it by taking the average of
a high point and a low point. After adjusting this parameter
(i.e changing the value in the cell B1), the two curves should
have the same (vertical) midpoint. If everything before was
done correctly, the chart will be updated automatically. 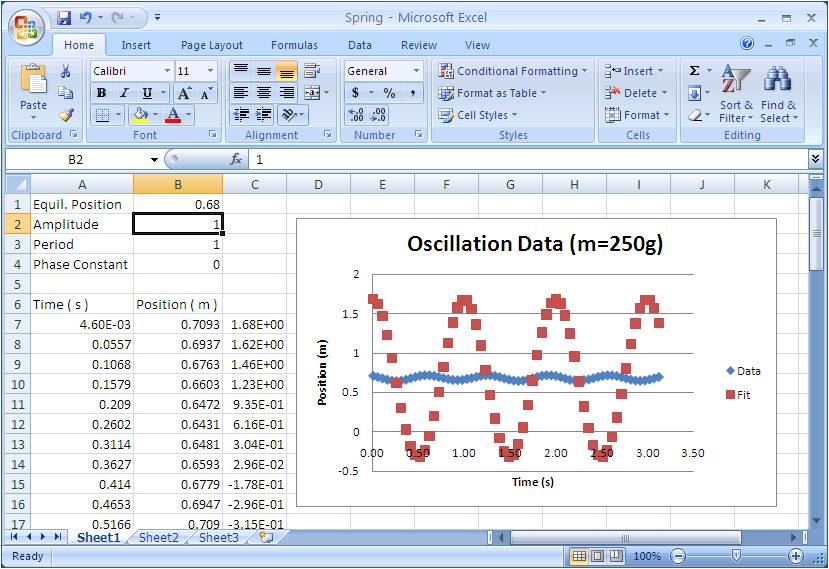 NEXT BACK NEXT BACK |