
 PYL 106: January 18


Oscillatory Motion
When a mass is hung vertically from a spring, the spring
stretches. There is a point at which the spring force and the
weight are equal in magnitude but opposite in direction. This
point is called the equilibrium position. If the mass
is in any other position, there is a net force called the
restoring force directed toward the equilibrium position.
The restoring force results in the mass eventually returning to
the equilibrium position. The mass, however, picks up some
momentum and continues past the equilibrium position causing
the same situation as before but on the opposite side of the
equilibrium position. The outcome is a repeated motion in
which the mass passes through the equilibrium position, turns
around, heads back toward the equilibrium position, passes
through it, and so on. Such behavior is called oscillatory
motion.
The position of a mass oscillating on a spring can be described
by the following equation
y(t) = yeq + A cos
( 2 p
t / T + f ).
It is assumed that the argument (the stuff in the parentheses,
a.k.a. "the phase") is in radians and NOT degrees. Note that
there are four parameters
- yeq: the equilibrium position, determines the
midpoint of the motion
- A: the amplitude, determines the size the the
oscillations, i.e. the maximum displacement from the equilibrium
position
- T: the period, determines how much time goes
by before the motion begins to repeat itself
- f: the phase
constant, determines the part of the cycle at the beginning
(t=0)
Experiment
- Plug a motion sensor into the signal interface (which
should have been turned on before the computer), the yellow plug
should go into Digital Channel 1, the other into Digital Channel 2.
- In Science Workshop, drag the digital channel icon into
Digital Channel 1 and choose Motion sensor. Set the trigger rate
to 60 Hz. For our sensors to work properly the mass and the sensor
should be at least 0.5 meters apart.
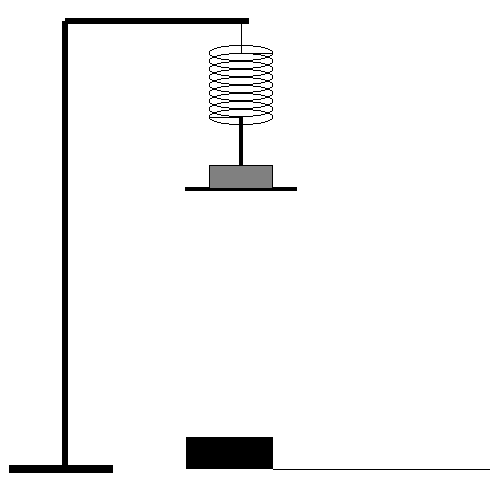
- Place a mass on a spring hanging from a tall ringstand
with a motion sensor positioned beneath as shown below.

- Record the mass, don't forget to include the mass of the
hanger.
- Set the mass into oscillatory motion (stretch the spring
a few centimeters and release) and begin recording data. You only
need to record a couple cycles. Try to ensure that the motion
is vertical.
- Within Science Workshop, make a table of the position
data. Click on the clock to get the times as well.
- Copy the column generated and paste it into an Excel
spreadsheet.
- Repeat this procedure with several different masses (at
least three others, changing the mass by at least 50 g).
Analysis
- For each of the masses, plot position versus time [an XY
(Scatter) Chart in Excel]. On the same graph, plot a
mathematical function that resembles as much as possible
your data.
( Click here
for some help with this.)
- You should be able to identify in your function
the equilibrium position, the amplitude, period and phase
constant associated with this oscillatory motion. Include in
your report a table of the masses and this information.
- Plot weight (mass times g) versus yeq and fit
it to a straight line. Extract from the fit the force constant
of the spring k.
- Make a graph of the period T versus mass. Use the Add
Trendline feature to fit your curve to a power law.
The Display equation on chart option will tell
you what power law fits best. (Ask if you don't know what
I mean.)
- Compare your periods to the theoretical values
T = 2 p ( m / k )1/2.
- Suggest a source of systematic error in
this comparison.


 PYL 106: January 18


 Click here
for some help with this.)
