Lab 4: Forces and Vectors
According to Newton's Second Law
where F is the net external force acting on an object. In this experiment we will consider the situation of static equilibrium, i.e. a case in which nothing is moving. If an object is not moving, then it is not accelerating and Newton's Second Law implies that there is no net force on the object.
Note that "no net force" does not mean there are no forces on the object, nor does it mean no motion. Instead, it implies that that the effects of all of the forces acting on the object cancel, and there is no acceleration (i.e. no change in the velocity of the object).
Forces have a both a magnitude and a direction. The magnitude is the size of the push or pull supplied by the force, while the direction describes in which the force is applied to an object. Forces must then be represented mathematically by vectors. The net force is then necessarily a vector sum, which may be calculated algebraically by using vector components.
Expressing a vector in terms of its components is also known as "resolving" the vector. Consider F in the following diagram. To resolve F into components, find the angle between the x-axis and F as shown. There are two conventions for measuring angles:
- Measure the angle starting from the positive x-axis, proceeding in a counter-clockwise direction and ending on the vector of interest. This approach results in angles between 0 and 360 degrees.
- Measure the angle between the x-axis (positive or negative, whichever is closer) and the vector of interest. This approach yields angles between 0 and 90 degrees, and one must make note of which quadrant the vector lies in.
We'll adopt the second method in the following discussion. Another thing to keep in mind when dealing with angles is to keep track of whether degrees or radians are the units.
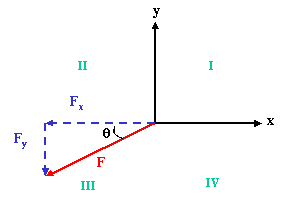
We can think of F and its x and y components (Fx and Fy) as the sides of a right triangle, with F as the hypotenuse and the components as the legs. Using the trigonometric relation
we can determine that with the angle as drawn above, Fx, the x-component of F is, up to a sign, given by
where |F| is the magnitude of F. Similarly, up to a sign the y component of F3 is given by
The signs of the components are determined by the quadrant location of the vector.
| Quadrant | Sign of x-component | Sign of y-component |
|---|---|---|
| I | + | + |
| II | − | + |
| III | − | − |
| IV | + | − |
Part I. Calibrating the Force Sensor.
- Plug a Force Sensor into Analog Channel A. Launch Data Studio, drag the analog plug icon into the Analog Channel A icon, and choose Force Sensor from the menu.
- Attach a force sensor to a ring stand as shown below. BEFORE placing
a weight hanger on the Force Sensor as indicated, press the TARE button
on the side of the sensor. This step establishes the "zero" of the Force
Sensor.
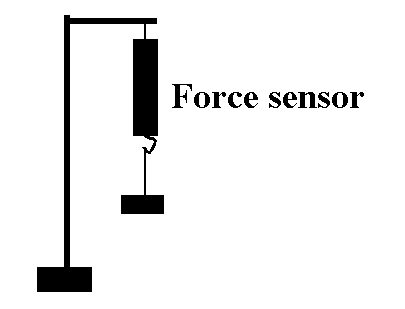
- Attach a weight hanger to the force sensor. Add a mass of 100 g.
- Press REC and take force data for a few seconds.
- Table the data and press the SIGMA button to obtain the mean force. We are only interested in getting the magnitude of the force (which is necessarily positive) from the source, so you don't have to worry about the negative sign the force sensor gives.
- Repeat the measurements with 200 g and 300g on the hanger, and compare the sensor readings with the theoretical value of the weights by filling in Table 2. Do you observe any errors in your force sensor readings? If so, are they systematic or random? Explain.
| Mass (kg) | Force(N) Measured | Force(N) Theory (mg) |
|---|---|---|
| 0.150 | ||
| 0.250 | ||
| 0.350 |
Part II. Resolving the force vector into components.
- Tie three strings to a washer. Two of the strings should be of a length
such that if the washer is in the center of the force table, the strings
can pass over a pulley at the edge of the table and hang several centimeters
below table level.
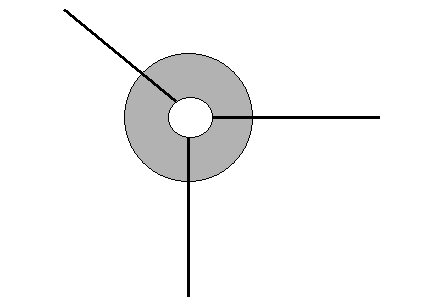
- Attach the two longer strings to hangers, allowing them to hang several centimeters below the pulleys and several centimeters above the lab table
- The length of the third string should be only slightly longer than the radius of the force table. This third string will be attached to the Force Sensor.
- Attach two pulleys to the force table so that they lie along perpendicular
radii. To do this, put one pulley at 360° and the second at 90°.
Place the longer strings over the pulleys and suspend mass hangers from
them. Add unequal masses (at least 100 g) to the hangers and determine
the weight of each mass (multiply by g=9.8 m/s2, don't forget
the mass of the hanger)
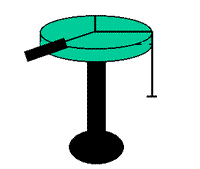
- Attach the hook of the Force Sensor to a loop at the end of your shorter string. Hold the Force Sensor so that the strings attached to the washer are horizontal (not vertical!) and so that the washer is over the center of the force table. Hold it there as steadily as possible while one partner clicks on Record in Data Studio -- you only need a few seconds. Also note the angle of the string attached to the Force Sensor (the angles are marked on the Force Table).
- Record the mean magnitude of the force from your Data Studio data.
- To calculate vector components, a coordinate system must be established.
Your force table with pulleys provide an efficient way to do this: take
the x-direction to point in the radial direction from the center
of the table toward the 360° mark and the y-direction to point
towards the 90° mark.
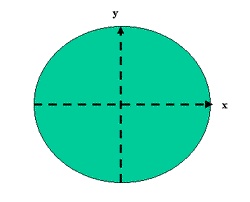
Now draw the three forces in this coordinate system. (Note: When drawing vectors the lengths of the lines are usually proportional to the magnitudes of the vectors. This is not true in this picture.)
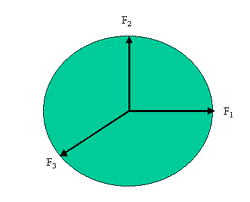
Note that the setup of pulleys defining the coordinate system implies that F1 has only a positive x-component and F2 has only a positive y-component. - Vectors can be added algebraically by adding the respective components.
For this experiment, the x-component of the net force acting on
the washer (Fnet=F1+F2
+ F3) is then
Fnet,x= F1 + F3x
and the corresponding y component is
Fnet,y= F2 + F3y - For a vector to be zero, all of its components must be zero. Thus the two expressions above should yield zero because the washer is in equilibrium. Verify this by completing the following table.
| Magnitude | Angle | Quadrant | Fx | Fy | |
|---|---|---|---|---|---|
| Force 1 | |||||
| Force 2 | |||||
| Force 3 | |||||
| Sum |
- Note that you cannot use a theoretical value of 0 for the purposes of
determining a percentage error (why is this?). To quantitatively describe
your error then, note that , because Fnet=0
F3=−(F1+F2)
Instead of comparing the net force to zero, then, compare the absolute values of the components of F3 with the absolute values of the components of F1+F2. With the coordinate system in this experiment, the components of this sum are easily found, and therefore.
|F1| = |F3x| and |F2| = |F3y|
Now you can calculate error quantitatively by comparing |F1| with |F3x| and |F2| with |F3y| . Construct your own table and make these comparisons, determining the percentage difference between the numbers.
- Change one of the masses (make a change of at least 50 grams) and repeat the measurement and calculations.
| Magnitude | Angle | Quadrant | Fx | Fy | |
|---|---|---|---|---|---|
| Force 1 | |||||
| Force 2 | |||||
| Force 3 | |||||
| Sum |
- Perform the same comparisons that you did for the Trial 1 data.
Be sure to comment on the nature of the error in this lab in your lab report!