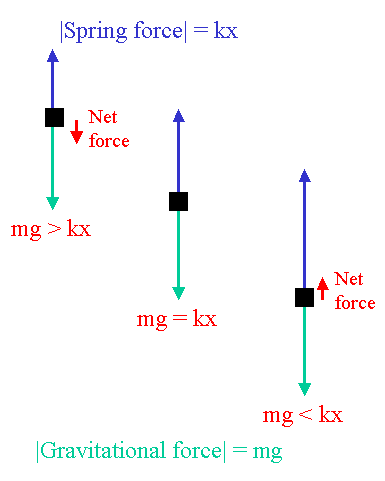
The restoring force results in the mass eventually returning to the
equilibrium position. The mass, however, picks up some momentum and continues
past the equilibrium position causing the same situation as before but on the
opposite side of the equilibrium position. The outcome is a repeated motion in
which the mass passes through the equilibrium position, turns around, heads
back toward the equilibrium position, passes through it, and so on. Such
behavior is called oscillatory motion.
(See Chapter 12 in Principles of Physics by Serway and
Jewett.)
The position of a mass oscillating on a spring can be described by
the following equation
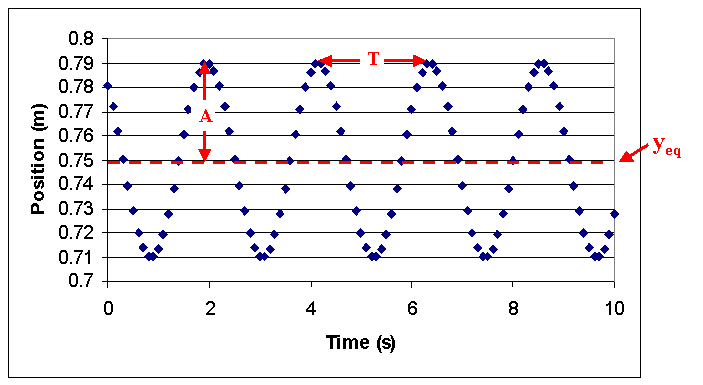
y(t) = yeq + A cos ( 2 p t / T + f ).
(See eqs. 12.6 and 12.12). The term yeq is needed in an
experiment because the origin is determined by the location of the measuring
device, thus the origin cannot be chosen to be the equilibrium position as is
typically done in the theoretical account. It is assumed that the argument
(the stuff in the parentheses, a.k.a. "the phase") is in radians and
NOT in degrees. Note that there are four parameters
- yeq: the equilibrium position, determines the midpoint
of the motion
- A: the amplitude, determines the size the the
oscillations, i.e. the maximum displacement from the equilibrium position
- T: the period, determines how much time goes by before the
motion begins to repeat itself
- f: the phase constant, determines
the part of the cycle at the beginning, when t=0.< /LI>
 Experiment
- Plug a motion sensor into the PASCO signal interface (which should have
been turned on before the computer), the yellow plug should go into Digital
Channel 1, the other into Digital Channel 2.
- In Science Workshop, drag the digital channel icon into Digital Channel
1 and choose Motion sensor. Set the trigger rate to 60 Hz. For our sensors
to work properly, the mass and the sensor should be at least 0.5 meters
apart.
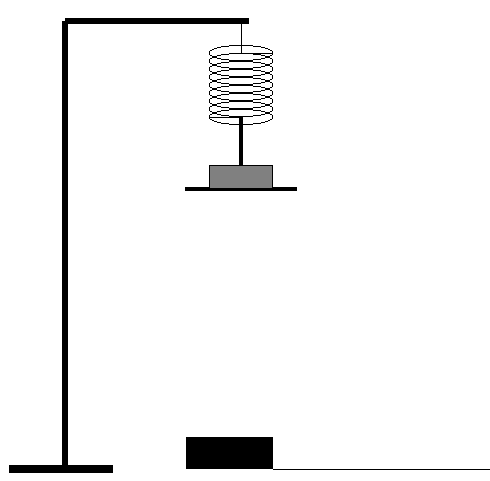
- Place a mass on a spring hanging from a tall ringstand with a
motion sensor positioned beneath as shown below. The bar from which the mass
hangs should be as far as possible from the motion sensor (i.e. at the top
of the ringstand). Do not change its position during the experiment or
you will have to retake all of your data.

- Mass Variations
- Record the mass, don't forget to include the mass of the hanger.
(Enter the sum in the first column of the Mass Variations table in
the analysis section.)
- Set the mass into oscillatory motion (stretch the spring approximately
three centimeters and release) and begin recording data. You only need to
record a few cycles. Try to ensure that the motion is vertical.
- Within Science Workshop, make a table of the position data. Click on
the clock to get the times as well.
- Copy the column generated and paste it into an Excel spreadsheet.
- Repeat this procedure with several different masses (at least three
others, changing the mass by at least 50 g).
- Use a balance to determine the mass of your spring.


 PYL 106: Mass on a Spring


