

 PYL 106: Pendulum


The Pendulum
A mass hanging from a string or attached to a rigid rod, i.e. a pendulum, is
another example of a system which exhibits periodic motion. (In such a case, the
mass is known as a bob.) The equilibrium position is when the string or rod
hangs vertically. If the pendulum is not in this position, there is a restoring
force. One of the quantities studied for a pendulum is the angle between the
string and the vertical. Remember the angles we are talking about will be
measured in radians.
Recall that the period T is the time it takes before the motion starts
repeating itself. We want to study the effect on the period of varying
- the mass of the bob
- the length of the string
- the amplitude, i.e. the maximum angle between the string and the vertical
(Note that we will use a mass on the end of a string to study the
effect of mass and length variations, and we will use a rigid-rod pendulum to
study the amplitude variations.) You should make sure that when varying one
parameter, the others are held fixed.
The forces acting on the bob of a pendulum are its weight and the tension of
the string. It is useful to analyze the pendulum in the radial/tangential
coordinate system. The tension lies completely in the radial direction and the
weight must be broken into components.
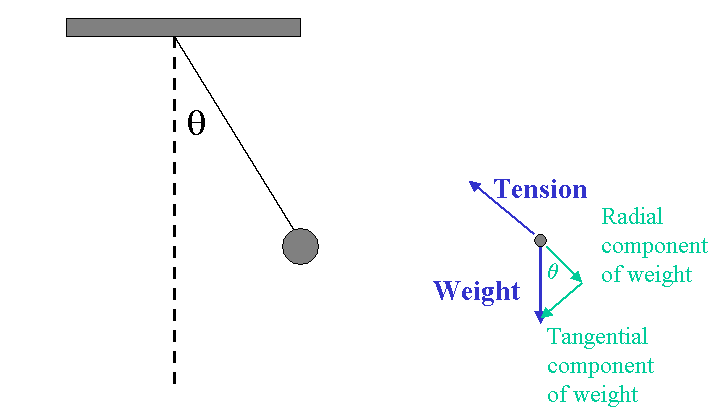
The net radial force leads to radial acceleration, which is a centripetal
acceleration.

where r = l, the length of the pendulum. The net
tangential force leads to a tangential acceleration.
 where the tangential acceleration is l a and a is the angular acceleration,
d2q/dt2
Another approach to the pendulum is conservation of energy. At an arbitrary
angle, the energy is a combination of kinetic energy and gravitational potential
energy. At the highest point of the swing, the energy is entirely potential; at
the lowest point of the swing, the energy is entirely kinetic.

Putting these together yields

Experiment
- Plug a photogate into Digital Channel 1 of the interface (which should
have been turned on before the computer).
- Start Science Workshop, drag the digital plug icon into the Digital
Channel 1 icon, and choose Photogate & Pendulum from the menu.
- Using a ringstand, clamps, a mass, some string, and so on, set up a
pendulum as shown below.
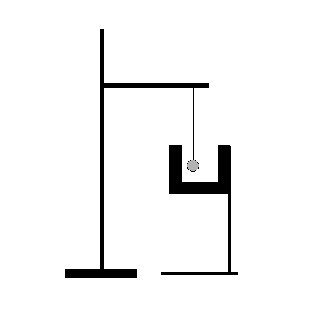
- Make sure that as the bob is moving, it passes through the center of the
U-shaped part of the photogate.
- Initiate the pendulum's motion, record data for a few periods.
- Drag a table into Digital Channel 1 and choose Period from the menu.
- Vary the bob mass.
- Tie bobs of different masses to your the end of your string. Use the
cylinders of the same size but different mass.
- To the best of your ability, make sure that the distance between the
length of the string from the crossbar to the center of mass of the
bob remains fixed.
- Make sure you release the bob from the same initial angle, you may want
to use a protractor.
- Record the masses and the periods for four different bobs.
Mass Variation
- Vary the pendulum length.
- Vary the length of the pendulum. To ensure a substantial range of
variation, your smallest length should be at most half as long as your
longest length.
- Keep the mass and amplitude fixed.
- Record the lengths and periods for five different lengths.
Length Variation
- Vary the amplitude.
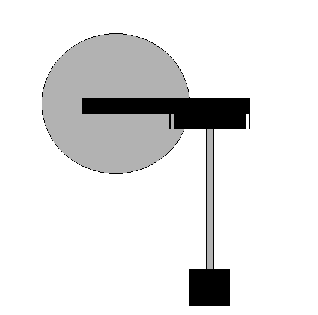
- Replace the mass-on-a-string pendulum with a rigid-rod pendulum, which
is shown below. It can be secured directly to the ringstand.
- Release the pendulum from different initial angles: 5°, 15°, 25°, 35°, 45°, and 55°.
- Record the corresponding periods.
Amplitude Variation
| Amplitude |
Period
( ) |
| 5 ° |
|
| 15 ° |
|
| 25 ° |
|
| 35 ° |
|
| 45 ° |
|
| 55 ° |
|
Maximum tension
- Close your Science Workshop file and start a new one.
- Replace the photogate with a force sensor. Force sensors are plugged
into the Analog channel.
- Click on the Sampling Options button. Set the sampling frequency to 50
Hz.
- Attach the force sensor to a pole on a ringstand as shown below.
- Tare the force sensor while nothing is hanging from it. (There's
a Tare buuton on the side of the Force sensor.)
- Tie the pendulum string to the force sensor as shown below.
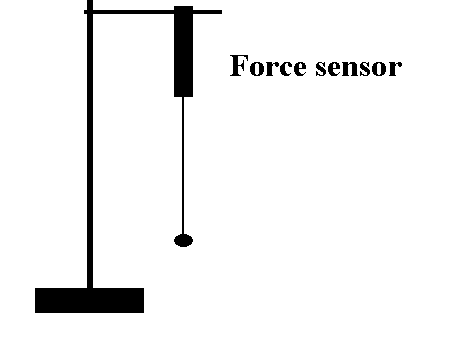
- Attach one of the hexagonal shaped masses to serve as the pendulum bob.
- With the mass in its equilibrium position, take a force sensor reading.
This will be the weight mg as measured by the force sensor.
- Release the mass from an angle of 20° , record
a few periods of data.
Analysis.
- Plot the period versus mass. What kind of dependence if any
do you see?
- Plot the period versus length. Fit it to a power law. What
power do you find? Does it agree with the theoretical prediction found in your
book?
- Plot the period versus amplitude. Compare your results with
the theoretical prediction found in your book. Do you observe any systematic
deviations from the predicted value for large angles? The derivation of this
formula assumes that the angle is small, so that
sin(q ) » q,
Make a table of q (in radians!) and sin(q) for the amplitudes used for the above measurements.
| q (in degrees) |
q (in radians) |
sin(q) |
¼ sin2 (q/2) |
| 5 |
|
|
|
| 15 |
|
|
|
| 25 |
|
|
|
| 35 |
|
|
|
| 45 |
|
|
|
| 55 |
|
|
|
According to Mathematical Methods for Physicists (G. Arfken, p. 322
in the third edition)

where qM is the amplitude. According to
this equation, does the period increase or decrease when the amplitude is
increased? Does this agree with your results?
- Using the force sensor data, plot Tension vs time. Extract
the tension with the maximum amplitude, which will be at the bottom of the
graph. It is approximately 5.4 N in the example shown below.
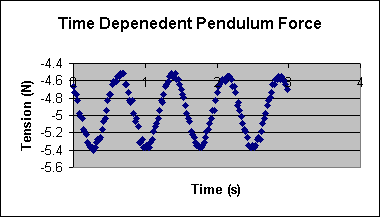 Compare Tmax/mg to the theoretical prediction of 3 - 2
cos(q).
| Tmax/mg |
3 - 2 cos(q) |
Percent diff. |
| |
|
|
- A "seconds" pendulum moves through its equilibrium position (the vertical)
every second. That means that its period is 2.00 s. If you had to build a
seconds pendulum, what would you use for its length, bob mass and amplitude?


 PYL 106: Pendulum


