
 PYL 106: Lenses and
Diffraction


You do not have to write an abstract and introduction for this lab report.
Thin Lenses
One use of refraction, the bending of light rays,
is lenses. There are two surfaces (air-to-medium and medium-to-air). If the
surfaces are approximately spherical and close together, one has what is called
a "thin lens". The results of the bending can be simplified into an equation
called the thin lens equation
1/p + 1/q = 1/f, where
- p is the distance from the source to the lens. Rays diverge from, i.e. are
sent out from, the source.
- q is the distance from the image to the lens. (It is measured on the
opposite side of the lens from p.)
- If the image is real, rays (really) converge there after having been
bent by the lens
- If the image is virtual, the rays seem to diverge from this point after
having been bent by the lens
- f is the focal length, it is a property of the lens. Two ways to think
about it are
- if p aproaches infinity (if the source is very far away) then q = f (the
image is at the focal length)
- if p approaches f (if the source is at the focal length) then q
approaches infinity (the image is very far away)
Because p and q are
measured from different sides of the lens, the distance f plays a special role
on either side of the lens
Part I.
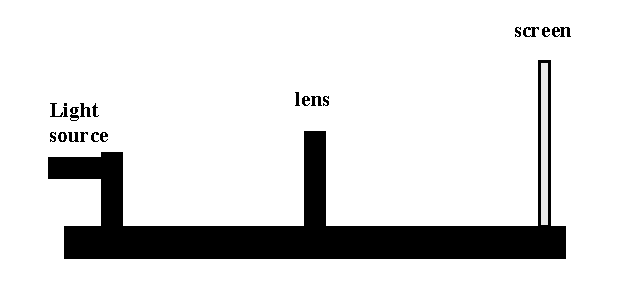
- Place a light source and screen on opposite sides of an Optics bench. In
between place one of the thin lens marked +100 mm.

- Adjust the position of the lens until the image on the screen comes into
focus.
- Measure the distance from the source (the frosted glass of the light
source) to center of the lens (call it p).
- Measure the distance from the screen to the center of the lens (call it
q). Enter them into the table below.
- The light source has arrows drawn on it, one should be pointing up. Note
whether the corresponding arrow in the image is pointing up or down. Enter in
the table below whether the image is inverted or upright.
- Measure the length of the source arrow, call it y0.
- Measure the length of the image arrow, call it yi. Enter them
in the able below.
- Test the relationship
m = yi/yo = |q/p| ,
- Next, without moving source or screen, find another position of the lens
for which the image comes into focus. Measure p, q, yo and
yi.
- Decrease the distance between screen and source and repeat the above
procedure. Find two sets of (p, q, yo, yi).
- Change the distance twice more finding two sets (p, q, yo,
yi) for each distance. (Note if the screen and source are too close
you cannot find a position where the image comes into focus.)
- Your p and q should obey the thin lens equation, see above. The quantity f
is the focal length. Solve for f for your various sets of data. Calculate the
average and the standard deviation.
+100 mm lens
p
( ) |
q
( ) |
yo
( ) |
yi
( ) |
q/p
|
yi/yo
|
f
( ) |
Upright or
inverted? |
| |
|
|
|
|
|
|
|
| |
|
|
|
|
|
|
|
| |
|
|
|
|
|
|
|
| |
|
|
|
|
|
|
|
| |
|
|
|
|
|
|
|
| |
|
|
|
|
|
|
|
| |
|
|
|
|
|
|
|
| |
|
|
|
|
|
|
|
| Average Focal length ( ) |
|
| Standard deviation ( ) |
|
- What distance between source and screen is too close for one to bring the
image into focus? How is it related to f?
First source-to-screen
distance where image
cannot be found
|
Relationship to focal length |
| |
|
- Draw a reasonably accurate ray diagram for one of your measurements above.
Part II
- Place the diverging (-150 mm) lens several centimeters from the light
source. Measure the source distance p1 from the light source to the
lens.
- Using the thin lens equation, your source distance p1 and a
focal length of -15 cm, calculate the image distance q1.
p1 (measured)
( ) |
q1 (calculated)
( ) |
| |
|
- Place the converging (100 mm) lens several centimeters on the other side
of the diverging lens. Place the screen after that. Adjust the position of the
screen (and perhaps the 100 mm lens) until you find a sharp image on the
screen. Record D (the distance between the lenses), q2 (the
distance from converging lens to screen), yo (height of the source)
and yi (height of the image).
Distance between
lenses (measured)
( ) |
q2 (measured)
( ) |
yo
( ) |
yi
( ) |
| |
|
|
|
- Given that the image of the first lens serves as the source of the second,
determine p2, the source distance for the second lens. Using the
thin lens equation, your p2 distance and a focal length of +10 cm,
calculate q2, the image distance from the second lens. Determine
the measured magnification (from y's) and the calculated magnification (from
p's and q's) and calculte the percent difference.
p2 (calculated)
( ) |
q2 (calculated)
( ) |
q2 (measured)
( ) |
Percent
Difference |
Magnification
(measured)
yi/yo |
Magnification
(calculated)
q2q1/p2p1 |
Percent
Diference |
| |
|
|
|
|
|
|
- Draw a ray diagram of the above scenario.
Part III.
- Place the coverging (+100 mm) lens more than 10 centimeters from the light
source. Measure the source distance p1 from the light source to the
lens.
- Using the thin lens equation, your source distance p1 and a
focal length of 10 cm, calculate the image distance q1.
p1 (measured)
( ) |
q1 (calculated)
( ) |
| |
|
- Place a second converging (200 mm or 250 mm) lens such that the source of
the second lens is inside (closer than) the focal length of the second lens.
Remove the screen and view the image from the second lens from a long distance
away. Adjust the position of the second lens until the image of the inner
circle drawn on the source just fills the circle of the second lens. Record D
(the distance between the lenses).
Distance between
lenses (measured)
( ) |
yo (diameter of
inner circle on source)
(
) |
yi (inner diameter
of second lens)
(
) |
| |
|
|
- Given that the image of the first lens serves as the source of the second,
determine p2, the source distance for the second lens. Using the
thin lens equation, your p2 distance and a focal length of +20 or
+25 cm, calculate q2, the image distance from the second lens.
Determine the measured magnification (from y's) and the calculated
magnification (from p's and q's) and calculte the percent difference.
p2 (calculated)
( ) |
q2 (calculated)
( ) |
Magnification
(measured)
yi/yo |
Magnification
(calculated)
q2q1/p2p1 |
Percent
Diference |
| |
|
|
|
|
- Draw a ray diagram of the above scenario.
******************************************************************************
Interfernce and Diffraction of Light
Just as we had
superposition of waves on a string and sound waves, we have superposition of
light waves. We will send laser light through a pattern of slits. We use laser
light as opposed to white light since laser light has a well defined wavelength
and because it is coherent (define coherence). According to Huygens' Principle,
the light that passes through these slits can be thought of as a new source. So
now we have multiple sources of light, just as we had multiple sources of sound
waves (speakers) in the superposition of sound lab. The waves from these sources
will interfere, sometimes constructively, sometimes destructively, yielding
bright and dark spots respectively.
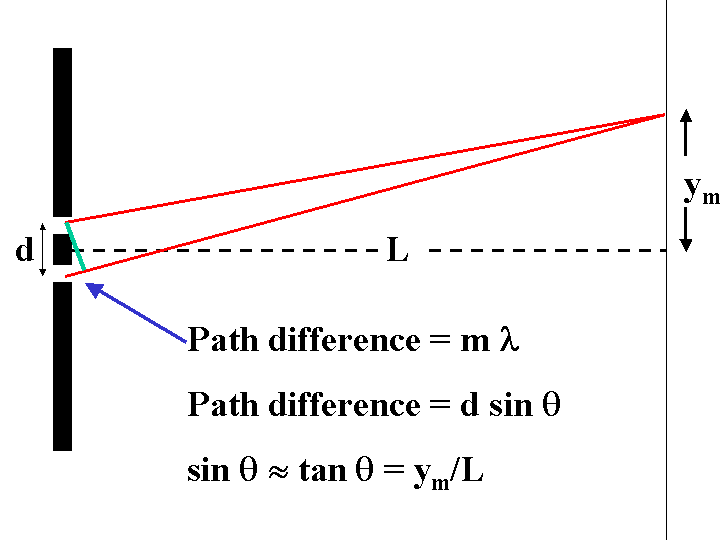
The centers of the bright spots should be at places of constructive
interference, i.e. where the path difference is an integral multiple of the
wavelength. After some analysis and approximations we are led to a relatively
simple formula
ym = m l L / d
where ym is the distance between the center spot and the
mth bright spot from it, m is an integer (1, 2, 3 ...), l is the wavelength of the light and d is the distance
between the slits.

Part I. Double Slit: Vary Distance Between Slits
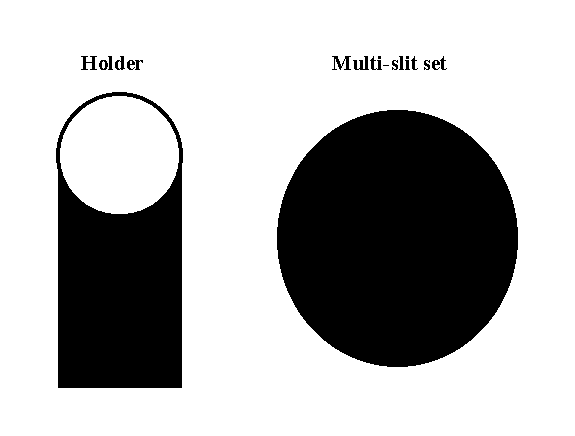
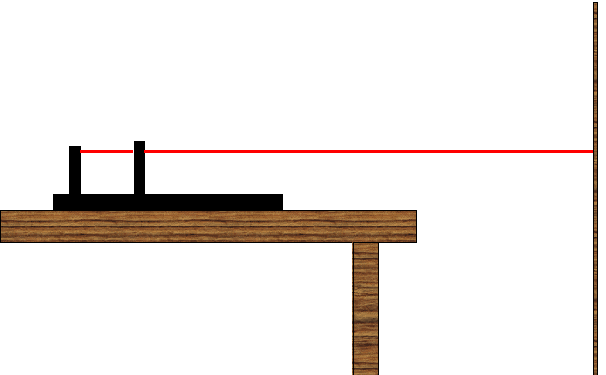
- Attach a multi-slit set (which is comprised of two parts shown below)

and a diode laser to an optics bench as shown below.

- Plug in the laser, turn it on, and adjust the horizontal and vertical
settings so that the beam goes through the slit(s) in the center of the
multi-slit set and ends on the screen (piece of paper taped to a cabinet or
wall across the room).
- Set the multi-set to the a=0.04 mm, d=0.5 mm double-slit setting (a
is slit the thickness, d is the distance between slit centers).
- Note the wavelength of light (if it's not stamped on the laser, look up
the wavelength of red light.)
- Record the distance L from the multi-slit set to the screen.
- Observe the interference pattern. Record y -- the distance between the
middles of the center spot and an adjacent bright spot.
- Measure the distance between two other adjacent spots (neither of which is
the center spot). How does it compare to y?
- Choose the a=0.04 mm, d=0.25 mm setting and repeat your
measurements.
- Choose the a=0.04 mm, d=0.125 mm setting (the double slit under the
multiple slit settings) and repeat measurements.
a
(mm) |
d
(mm) |
y1 (center)
( ) |
y (not center)
( ) |
| 0.040 |
0.500 |
|
|
| 0.040 |
0.250 |
|
|
| 0.040 |
0.125 |
|
|
Analysis
- Plot y versus d and fit it to a power law. Do your results
agree with the formula above?
Part II. Double Slit: Vary Distance Between Set and Screen
- Set the multi-set back to the a=0.04 mm, d=0.5 mm double-slit
setting.
- Change L, the distance from multi-slit set to screen, record it and
remeasure y, the distance between spots.
- Change L three more times, repeating the measurements. Make sure your
L's cover a substantial range.
L
|
y1 (measured)
|
y1 (theory)
|
Percent error |
| |
|
|
|
| |
|
|
|
| |
|
|
|
| |
|
|
|
| |
|
|
|
Analysis
- Plot y versus L and fit it to a power law. Do your results
agree with the formula above?
- Calculate the theoretical y's from the formula and compare them to your
experimental values.
Warning: Be careful with units in your calculations.


 PYL 106: Lenses and
Diffraction


