
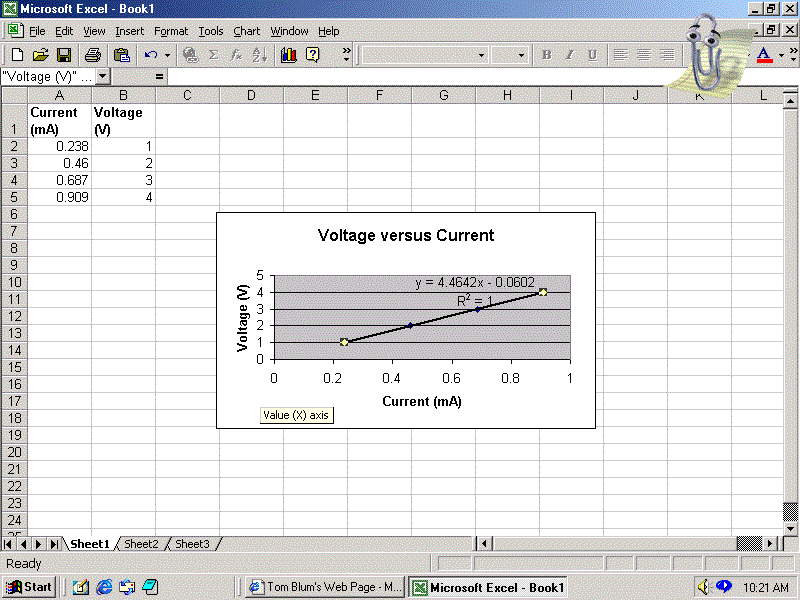
We are almost finished. Excel has placed the equation and R-squared value in an awkward place. If we click on that region of the chart, a box appears surrounding the text. We can drag the box to another place on the chart. (If we decide that we did not want the equation on our chart, we could highlight the box and press the Delete key or right click and select Clear.) Our final product is shown on the next page.
 PREVIOUS
NEXT
PREVIOUS
NEXT