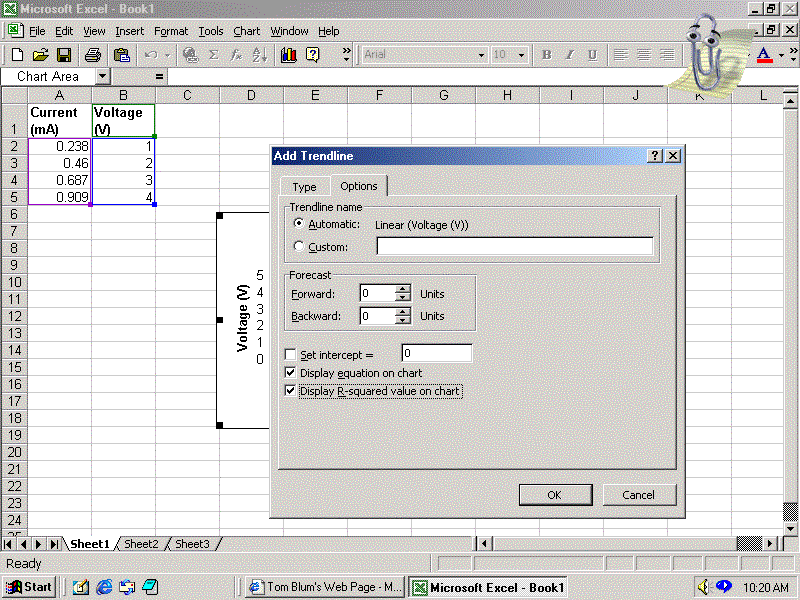


Under the Options tab, we check the Display equation on chart option. There is little sense in fitting data to a line without finding out the resulting equation for the line. In this example, we also check Display R-squared value on the chart option as well. The R-squared value is a measure of how good the fit is: a value near one implies that the data is well described by the equation; a lower value means a poorer fit. (Recall that our data should correspond to Ohm's law V=IR, which has the form y=mx as opposed to y=mx+b. Thus we could have checked the Set intercept = option and put 0 in the accompanying box, but we have elected not to do so.) The fit in shown on the next page.