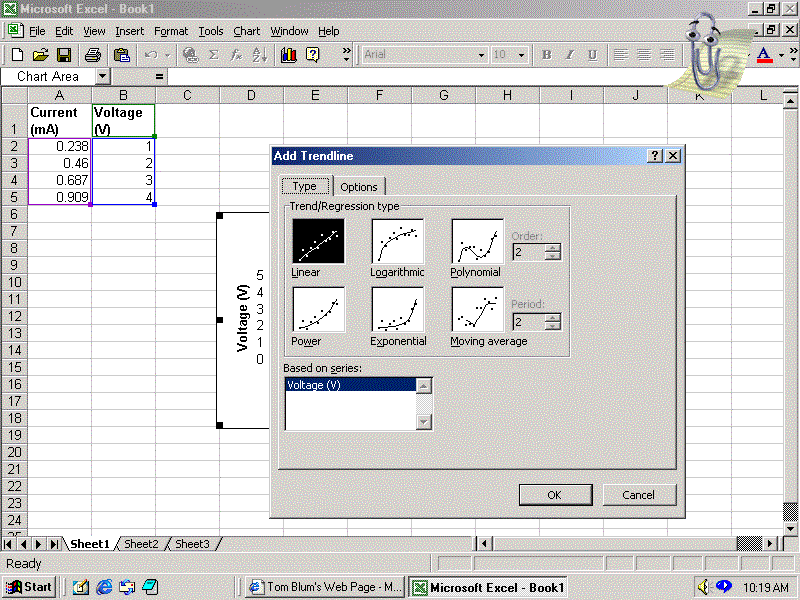


What scientists typically call a "fit," Excel calls a "Trendline." Under the Type tab, we select the mathematical function to which we want the data compared. In the current example, we want to find the straight line that is closest ("best fits") the data, i.e. we want to "fit to a line." Thus the Linear type is highlighted. Then we click on the Options tab shown on the next page.