
 Plotting the Electric Potential in Excel


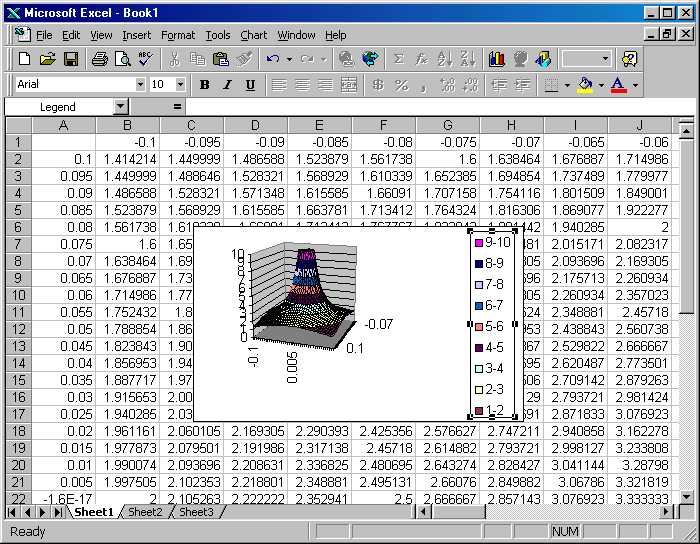
- The result should look like that plot shown below. Save and
print this graph.
- The position along the z axis, the height, represents
the size of the electric potential at the point r=(x,y).
- If a positively charged test particle were introduced into
this system, it would behave somewhat like a particle placed on
a mountain shaped like the figure below. It would slide
down the mountain, its acceleration related to the steepness of
the slope.

Note that the volcano-like shape is cut off at ten not because that is
what the electric potential is really like but because that's where we
told Excel to stop drawing it.
 NEXT
NEXT
 BACK
BACK


 Plotting the Electric Potential in Excel


