
 Plotting the Electric Potential in Excel


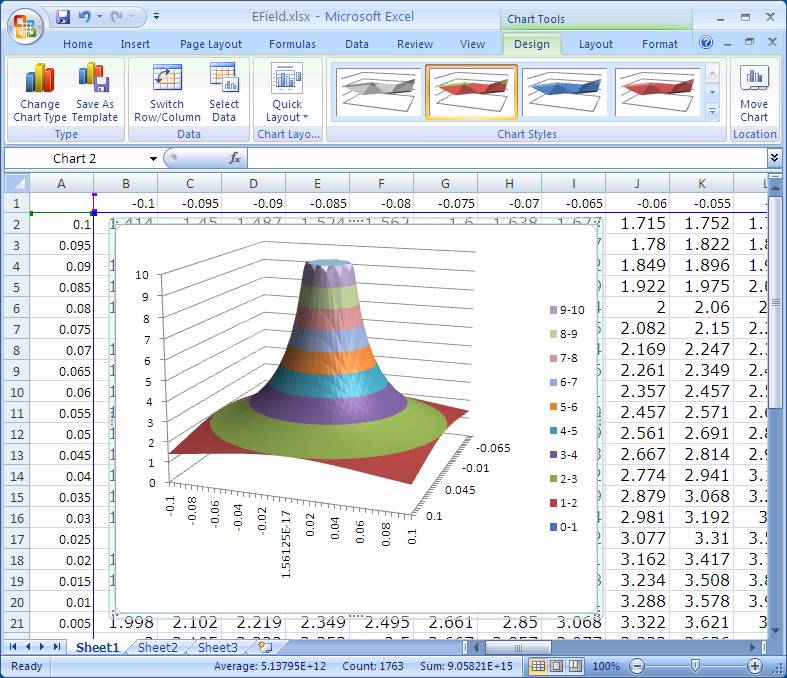
- The result should look like that plot shown below. Save and
print this graph.
- If you choose not to print the graphs and want to move them to Word, you
may find that copying and pasting the graph into Word tends to freeze the
computers. Instead you can hit the PrintScreen button on the keyboard on the
upper right which makes a picture of the entire screen and places it on the
clipboard, or you can hit Alt-PrintScreen which will places a picture only of
the highlighted item on the clipboard. Then you can paste this screen capture
into Word. Finally in Word if you select the screen capture and click on the
Picture Tools/Format tab, then you can find the crop tool (probably) on the
upper right, which will allow you to select only the portion of the screen
capture that you want.
- The position along the z axis, the height, represents
the size of the electric potential at the point r=(x,y).
- If a positively charged test particle were introduced into
this system, it would behave somewhat like a particle placed on
a mountain shaped like the figure below. It would slide
down the mountain, its acceleration related to the steepness of
the slope.

Note that the volcano-like shape is cut off at ten not because that is
what the electric potential is really like but because that's where we
told Excel to stop drawing it.
 NEXT
NEXT
 BACK
BACK


 Plotting the Electric Potential in Excel


 Plotting the Electric Potential in Excel


