Plotting the Electric Potential in Excel
Paste your plot into a Word document.
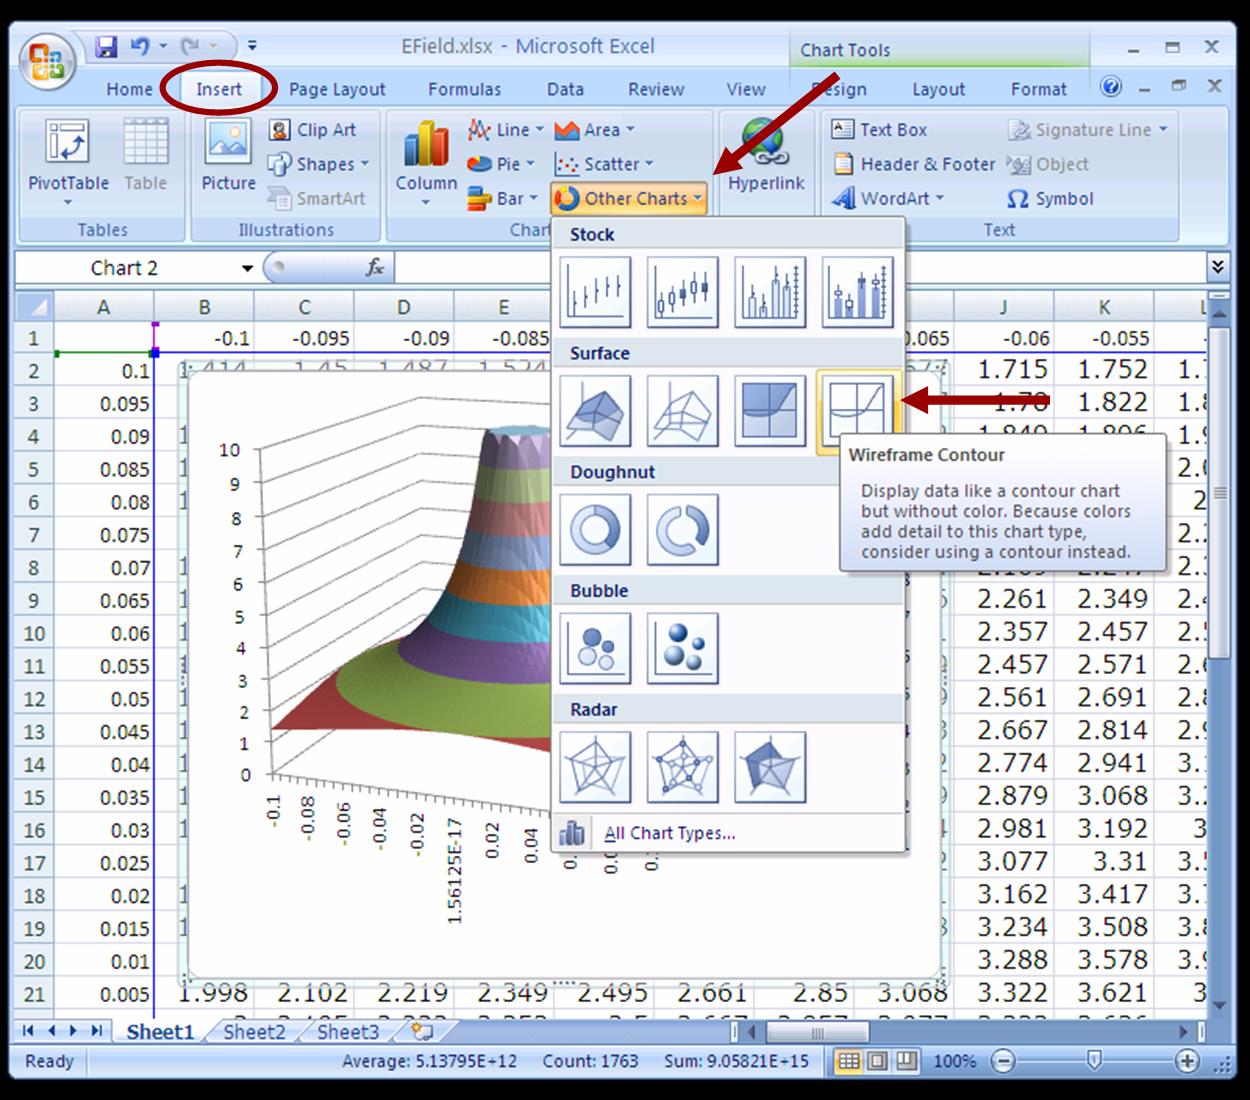
Before generating some more data corresponding to two charges, let us plot the data another way.
With the graph selected, go to
Insert/Other Charts/Surface/Wireframe Contour
.
NEXT
BACK
 Plotting the Electric Potential in Excel
 Plotting the Electric Potential in Excel