Plotting the Electric Potential in Excel

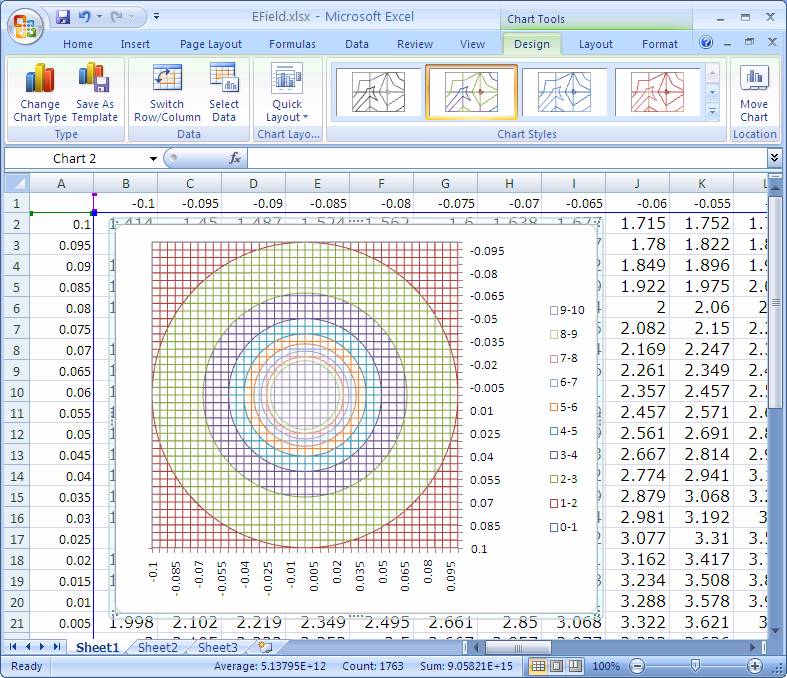
- You should obtain a graph like that shown below. Print it out.
- The circles represent positions that all have the same
electric potential and hence are called equipotential
sufaces.
- The inner most circle has an electric potential of
10 volts, the next 9 volts, and so on, down to 2 volts.
NEXT
BACK